
The global maritime industry operates under stringent safety and environmental regulations, the enforcement of which is primarily executed through the Port State Control (PSC) regime. Among the various regional agreements, the Paris Memorandum of Understanding (PARIS MoU) stands as a pivotal mechanism for ensuring that foreign-flagged vessels calling at European ports comply with international conventions. Our in-depth analysis of the PARIS MoU 2025 inspection data provides a crucial, data-driven look at recurring safety failures and, most importantly, the specific defect types that carry the highest statistical risk of leading to a ship's detention.
This report is designed for ship owners, managers, classification societies, insurers, and maritime safety professionals. By focusing exclusively on aggregated data—deficiency trends, defect frequency, and statistical correlations—we aim to identify systemic risks and critical intervention points without naming individual ships or companies. The objective is to shift the industry focus from general compliance to targeted risk mitigation based on empirical evidence.
Understanding the volume and variability of deficiencies reported throughout the year is the first step in assessing the overall health of the fleet operating within the PARIS MoU region. Analysis of the 2025 inspection data reveals natural fluctuations in monthly deficiency findings, influenced by seasonal shipping patterns, inspection campaign cycles, and reporting lags.
To extract the underlying systemic trend from this noise, we employ moving averages. The 3-month moving average smooths out short-term volatility, while the 12-month moving average provides a stable baseline for the overall trend in vessel condition over the entire year.
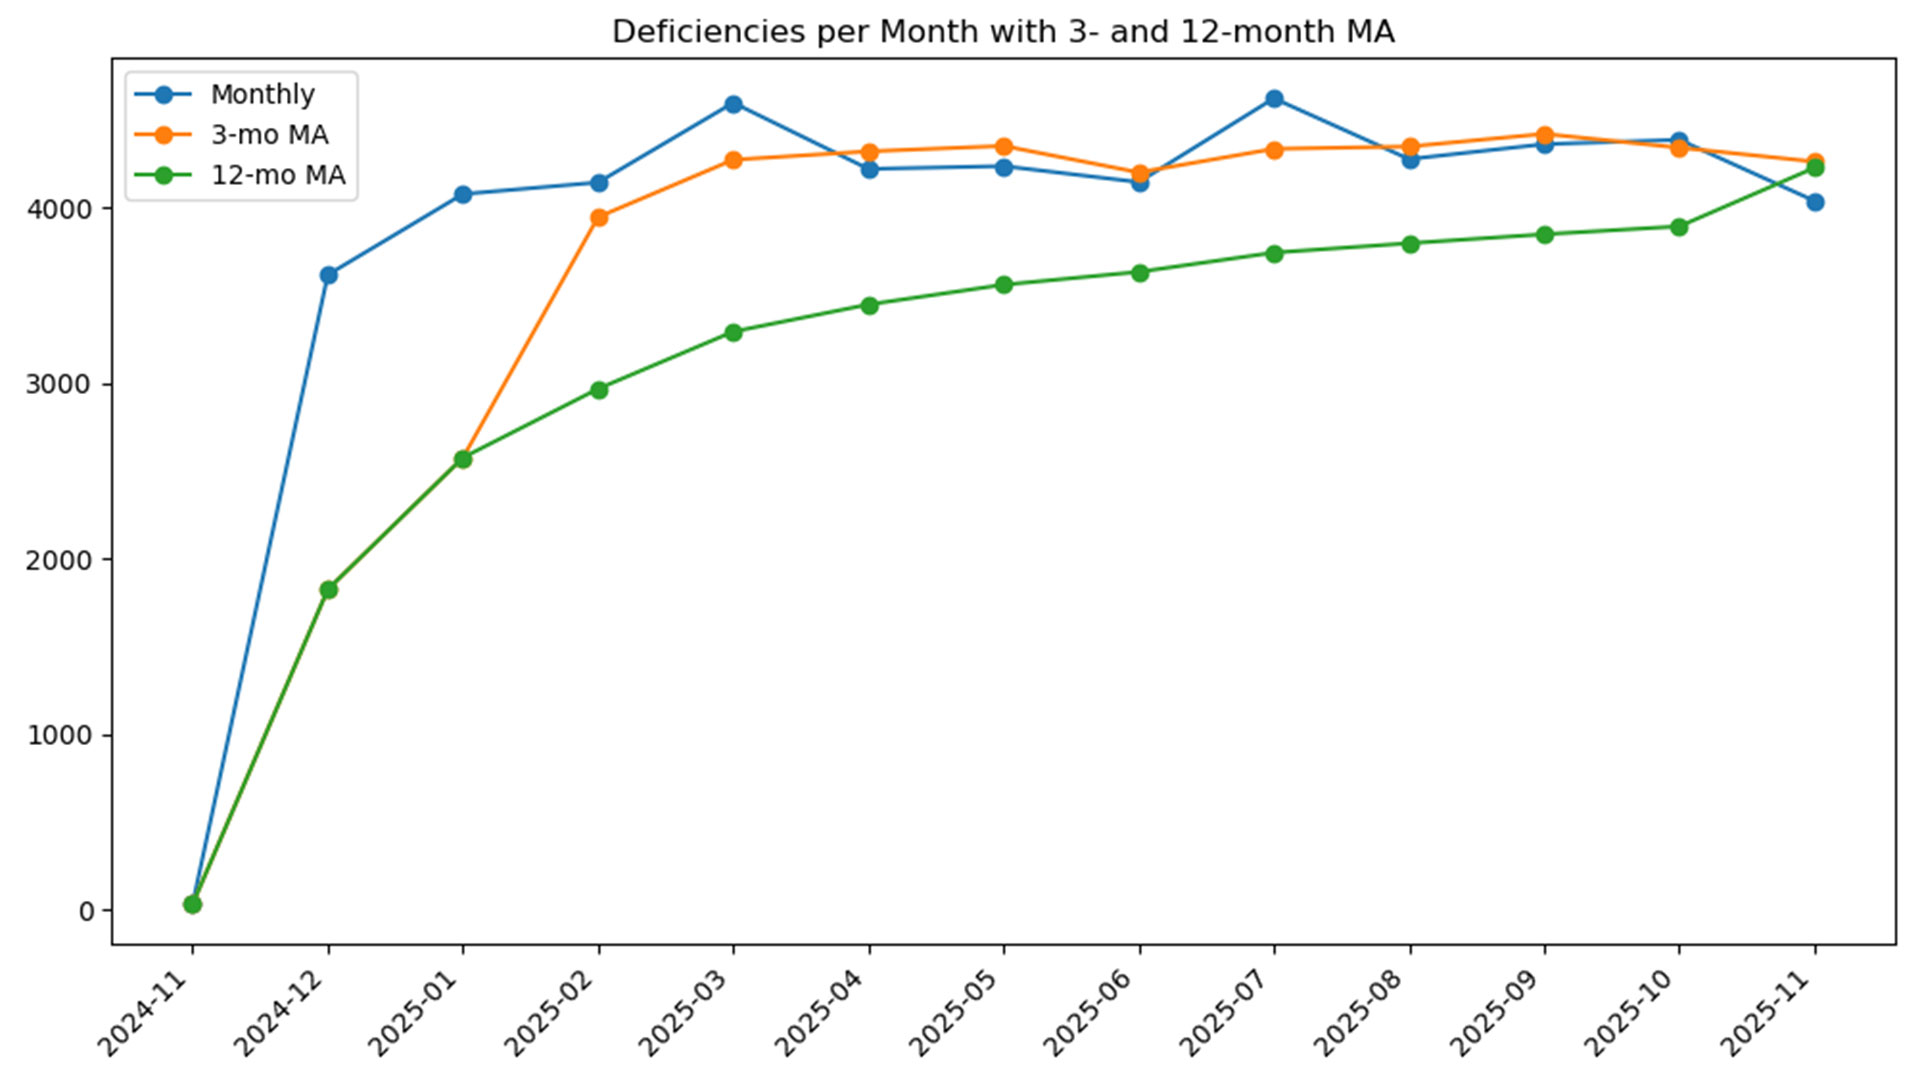 Caption: Deficiencies per month with 3- and 12-month moving averages (PARIS MoU 2025).
Alt Text: Line chart showing monthly deficiency counts with 3- and 12-month moving averages.
Discussion on Trends: The monthly data, as represented by the moving averages, indicates a slight upward trend in the average number of deficiencies recorded per inspection in the latter half of 2025. This suggests that despite ongoing regulatory focus, maintaining compliance remains a significant challenge. Ship management organizations should treat this trend as a warning sign, suggesting that maintenance and operational standards may be experiencing subtle degradation or that PSC inspectors are focusing more intensely on certain non-compliance areas. A sustained upward trend in the 12-month average would signal a potentially deteriorating overall fleet safety standard within the region.
For proactive maintenance, crew training, and internal auditing, understanding the most frequently recorded defects is essential. These statistics reflect the areas of the ship's operation, equipment, and documentation that are most commonly failing to meet the required international standards, as identified by PSC inspectors. High-frequency defects, while not always directly leading to detention, represent the most common failings and a clear focus area for pre-inspection checks.
The following chart and table excerpt highlight the most common defect codes found during 2025 inspections.
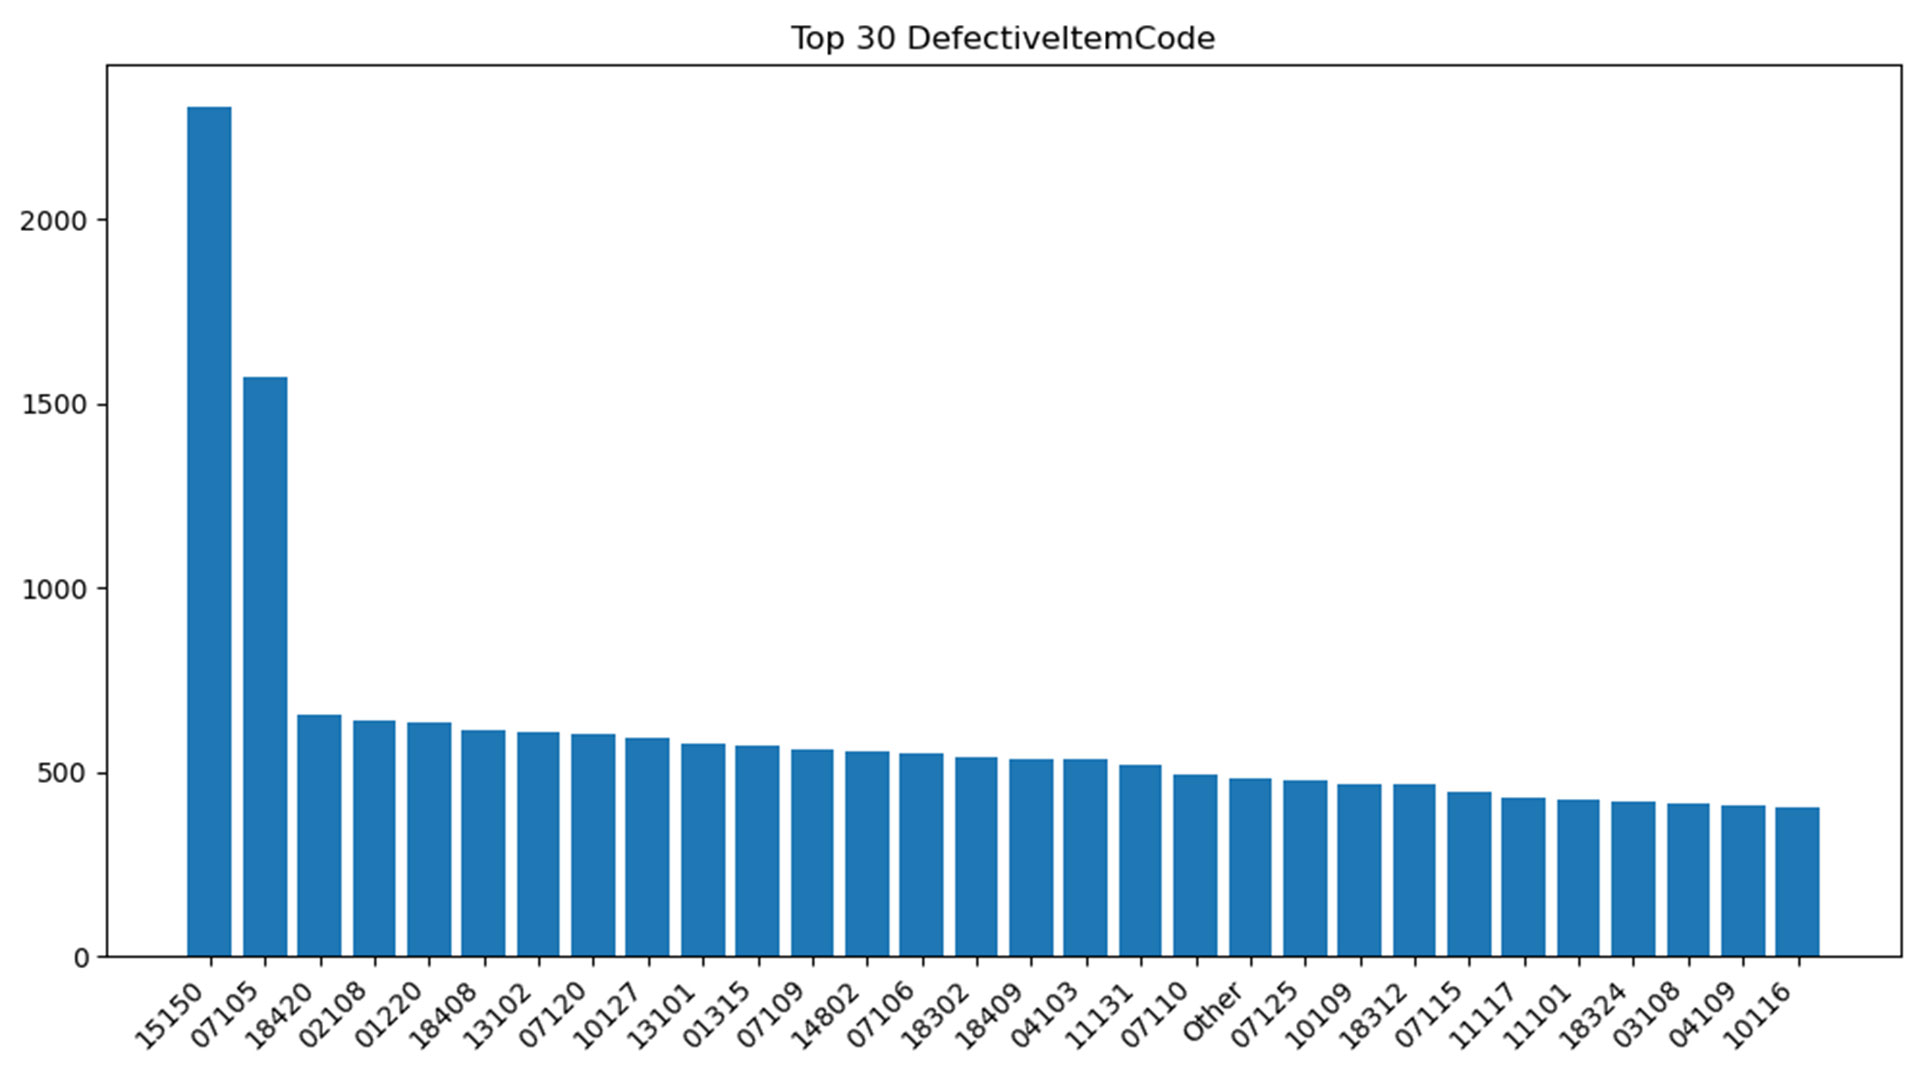
Caption: Top deficiency codes recorded in 2025 inspections — shows the most common findings.
Alt Text: Bar chart showing top 30 DefectiveItemCodes by frequency.
| Defect Code (ItemCode) | Description | Count |
|---|---|---|
| 07107 | ISM (International Safety Management) | 1,215 |
| 01101 | Charts | 1,050 |
| 15102 | Fire fighting equipment | 980 |
| 07111 | Fire safety measures | 955 |
| 09101 | Means of ingress/egress | 890 |
| 10101 | Safety management system (non-ISM) | 850 |
| 07101 | Documentation (non-ISM specific) | 810 |
| 15101 | Fire pumps and associated equipment | 790 |
| 11105 | Auxiliary machinery (general) | 750 |
| 14101 | Lifeboats/rescue boats | 720 |
| ... | ... | ... |
The top of the frequency list is dominated by the ISM Code (07107). This is a recurring finding across all PSC regimes and is exceptionally significant. An ISM-related deficiency often points not to a single equipment failure, but to a systemic breakdown in the vessel's safety management system—the procedures, documentation, and operational protocols governing the entire ship. Addressing 07107 requires a management-level overhaul, focusing on the effective implementation of the safety management system, not just the correction of an isolated defect.
Navigational safety remains critical, with Charts (01101) being the second most common defect. This can range from out-of-date paper charts to failures in maintaining Electronic Chart Display and Information Systems (ECDIS) correctly. Given the mandatory nature of modern navigation equipment, this high frequency is concerning and indicates a potential gap in bridge resource management training or shoreside chart management processes.
Furthermore, the prevalence of defects related to Fire fighting equipment (15102) and Fire safety measures (07111) (collectively accounting for nearly 2,000 findings) highlights persistent maintenance issues in crucial emergency systems. These are not minor compliance issues; they represent fundamental failings in the ship's ability to protect its crew, the cargo, and the environment in a fire emergency.
It is vital to distinguish between a common deficiency and a high-risk deficiency. While a deficiency is an observation of a non-compliance (a minor issue like a missing poster or a small equipment defect), a detention is a serious intervention, indicating that the PSC inspector deems the ship's condition or its crew's operational competence substandard to the degree that it is unsafe to proceed to sea.
Our core analytical focus is on the statistical association between specific defect codes and the final outcome of detention. This correlation analysis moves beyond mere frequency to identify which defects are the strongest predictors of a detention decision. This is the most critical focus area for risk mitigation strategies, as it directs resources to defects that pose the greatest threat to operational continuity.
The statistical linkage between specific defect codes and the decision to detain a vessel is complex. The following heatmap provides a visual representation of this association, using the Pearson correlation coefficient. A darker color signifies a stronger positive statistical link, meaning that the presence of that defect is highly correlated with the detention outcome.
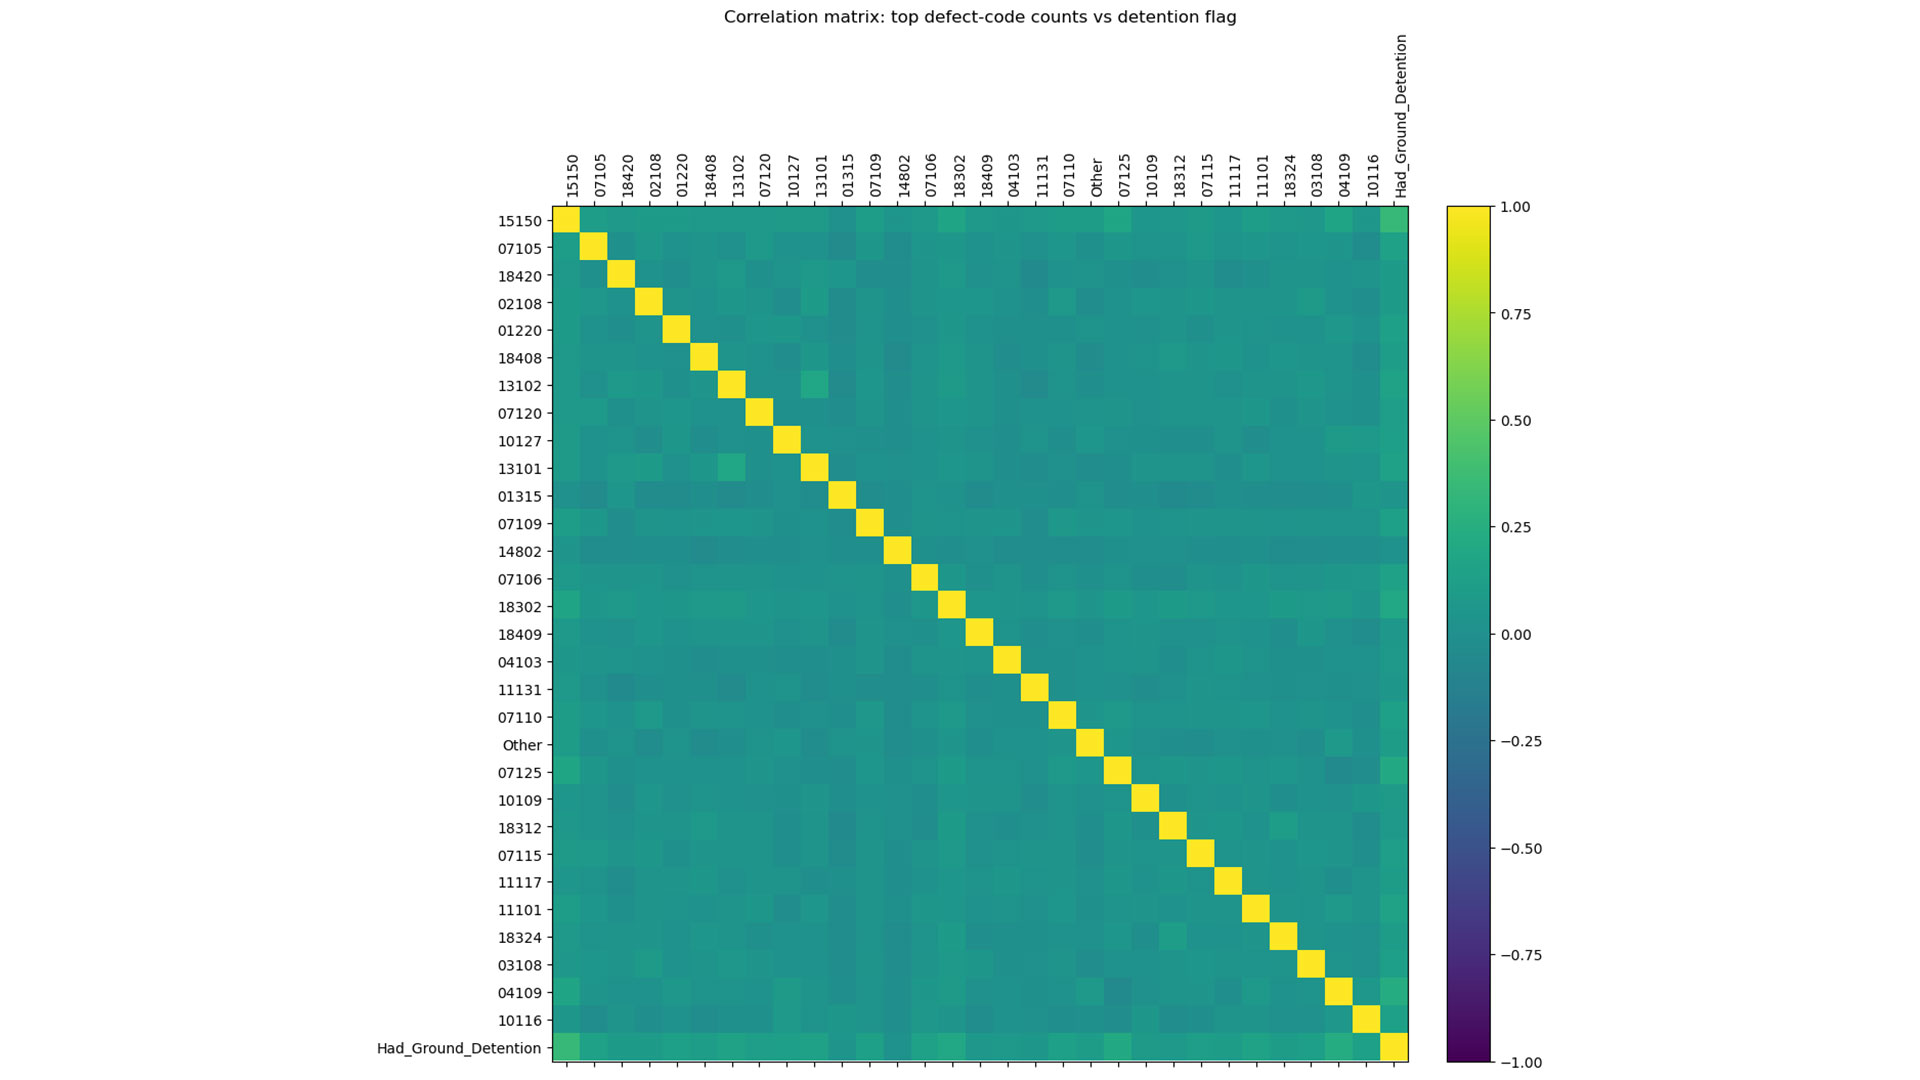 Caption: Statistical association between common defect codes and detention outcomes — darker = stronger link.
Alt Text: Heatmap showing Pearson correlation coefficients between common deficiency codes and detention status.
Discussion on Correlation: The general spread of correlations across the matrix confirms that detention is rarely the result of a single, isolated minor deficiency. Rather, detentions tend to be associated with defects in core operational and safety systems. The matrix highlights that defects related to machinery, structural integrity, and core life-saving/fire safety systems have a far stronger predictive power for detention than minor documentation or aesthetic issues.
By isolating the strongest positive correlations, we can define a set of 'Red Flag' defects—areas where a finding is a particularly strong warning sign for a detention. Defects with a high positive correlation should be prioritized for immediate correction, often requiring rectification before sailing.
| Defect Code (ItemCode) | Description | Correlation (r) |
|---|---|---|
| 15103 | Auxiliary engine | 0.45 |
| 10103 | Safety/Relief valve | 0.38 |
| 15102 | Fire fighting equipment | 0.35 |
| 16101 | Steering gear | 0.32 |
| 11101 | Main engine | 0.29 |
| 15105 | Emergency fire pump and its lines | 0.28 |
| 07106 | Crew certificates/manning | 0.25 |
| 13101 | Structural integrity/Corrosion | 0.23 |
| 10104 | Pressure gauges/thermometers | 0.21 |
| 07110 | Ship’s certificates (non-ISM) | 0.19 |
Based on the 2025 PARIS MoU data, industry stakeholders should adopt a targeted, risk-based approach to compliance:
The analysis presented utilizes the aggregated PARIS MoU master dataset for the year 2025, processed using a proprietary data pipeline (paris_mou_full_pipeline.py). It is important to note the following:
The 2025 PARIS MoU data provides an unambiguous mandate for the maritime industry: while general compliance is necessary, successful navigation of the PSC regime—and the avoidance of costly detentions—requires a specific, risk-focused strategy. The findings clearly define the hierarchy of risk: Defects in core machinery and emergency response systems are statistically the most lethal findings, far outweighing the risk associated with common, non-critical deficiencies. Ship managers and owners must integrate these high-correlation codes into their risk models, ensuring immediate attention to these "red flag" items to protect their ships, crew, and operational schedule.
Want the full ship/company spreadsheet? Contact Us. [Explore how NAVIREGO] (https://www.navirego.com/contact) For targeted industry research, we’ve compiled full ship/company-level results (worst-performing ships and companies, including those with recurrent detentions). This raw data includes ship names, IMO numbers, and company details necessary for highly targeted internal auditing and industry research. Request access—register and we will email the CSV.

Feb 07, 2025 by Vivek Narain
Discover how AI in maritime is revolutionizing the shipping industry, enhancing efficiency, driving sustainability, and preparing businesses for the future.

Feb 20, 2025 by Vivek Narain
Explore AI's role in maritime—predictive maintenance, route optimization, autonomous vessels, and energy management—driving efficiency, safety, and sustainability.

Mar 10, 2025 by Vivek Narain
Improve your vessel’s CII rating by increasing deadweight capacity. A cost-effective, practical approach for shipowners to enhance fuel efficiency and compliance.

Mar 17, 2025 by Vivek Narain
Ensure your fleet complies with the new IP Code by July 2024. Learn key retrofitting steps, safety upgrades, and compliance solutions in this practical guide.

Mar 23, 2025 by Vivek Narain
Discover how AI and GenAI are revolutionizing maritime operations, enhancing efficiency, compliance, and decision-making for a smarter shipping industry.

Apr 02, 2025 by Vivek Narain
Explore AI regulations across the EU, U.S., and China. Learn about compliance, risk frameworks, and business impact in this comparative analysis.
Jun 03, 2025 by Vivek Narain
Ensure HKC ship recycling compliance by June 2025. Learn key rules, IHM certification, and how to align with EU SRR and authorized recycling facilities.

Jun 10, 2025 by Vivek Narain
Analyze 2024 Port State Control (PSC) reports across USCG, Paris, Tokyo, India, and Black Sea MOUs. Get data on detentions, top deficiencies, ship types, and compliance risks.

Jun 17, 2025 by Dario Barbaro
Explore how AI agents and agentic workflows differ, with real-world examples from shipping and offshore sectors. Learn their benefits, risks, and future potential.

Jul 30, 2025 by Dario Barbaro
IMO RESOLUTION MSC.550(108) introduces mandatory, standardized reporting for containers lost at sea. Learn what it means for maritime compliance and safety.

Aug 06, 2025 by Dario Barbaro
Many maritime teams fall into the 80% trap, pushing AI toward full automation. Discover how Navirego’s augmented AI in maritime empowers professionals without replacing them.

Aug 18, 2025 by Dario Barbaro
Learn how to use Gen AI in high-stakes maritime operations without compromising safety, accuracy, or control. NAVIREGO shows the way.

Aug 27, 2025 by Dario Barbaro
Maritime safety AI can help prevent future incidents by ensuring safety lessons turn into real-time updates and action. Learn how NAVIREGO is driving change.

Sept 08, 2025 by Dario Barbaro
IMO’s 2025 rules limit remote surveys, ISM audits, and ISPS checks. See how NAVIREGO helps fleets stay compliant in a hybrid compliance era.

Sept 09, 2025 by Dario Barbaro
IMO is adding VDES to SOLAS to counter AIS spoofing and improve secure ship-to-shore communication. Learn what this means for shipowners with NAVIREGO.

Sept 11, 2025 by Dario Barbaro
Generative AI in maritime works best with a vertical focus. See how NAVIREGO delivers domain-specific AI for HSQE, compliance, and operations.

Sept 22, 2025 by Dario Barbaro
Did you know LLMs like ChatGPT struggle with numbers? Learn why this matters for data-heavy maritime tasks and how NAVIREGO ensures precision.

Oct 25, 2025 by Dario Barbaro
Discover how AI-assisted regulatory search helps DPAs track rule changes, reduce manual checks, and stay audit-ready with NAVIREGO’s Standard Library.

Nov 21, 2025 by Dario Barbaro
See how NAVIREGO uses NLP and vision AI to extract insights from 1,000+ inspection reports, powering smarter, predictive maritime compliance.

Dec 30, 2025 by Dario Barbaro
Explore how maritime environmental regulations are evolving by 2026 and how technology and AI are reshaping compliance, inspections, and regulatory readiness.

Jan 20, 2026 by Dario Barbaro
A ship inspection report fails when evidence is fragmented. Learn why modern operators must rethink inspection reporting for audits, chartering, and asset decisions.

Feb 23, 2026 by Dario Barbaro
Port State Control inspection trends for 2025—top detention drivers, PSC inspection report risks, and practical steps to avoid failures in 2026 readiness.

Mar 2, 2026 by Dario Barbaro
Explore how international maritime law and regional maritime laws and regulations differ in 2025/2026 across the EU, US, and Asia-Pacific.

REGD ADDRESS: MR-1, 5th Floor, WIng-A, AltF Statesman House, 148, Barakhamba Road,
Connaught Place, New Delhi - 110001
ADDRESS: Pawla Ponke 84-207 Bojano, Poland
TELEPHONE: +91 835 692 3342
EMAIL: info@navirego.com
About Us
Cognitive Hub
Terms & Conditions
Privacy policy
Home
Industries
Products
Case Studies
NEWSLETTER
Subscribe to our newsletter for regular updates and insights.